Measuring Success Rate: What to Log and What to Ignore
Pass-rate is the wrong metric. A small set of leading indicators tell you whether your pipeline is healthy.
Pass-rate is a lagging indicator. By the time it moves, your pipeline has been bleeding for a week. Track leading indicators instead: four numbers that move before pass-rate moves, and which tell you where the problem is.
The four you track
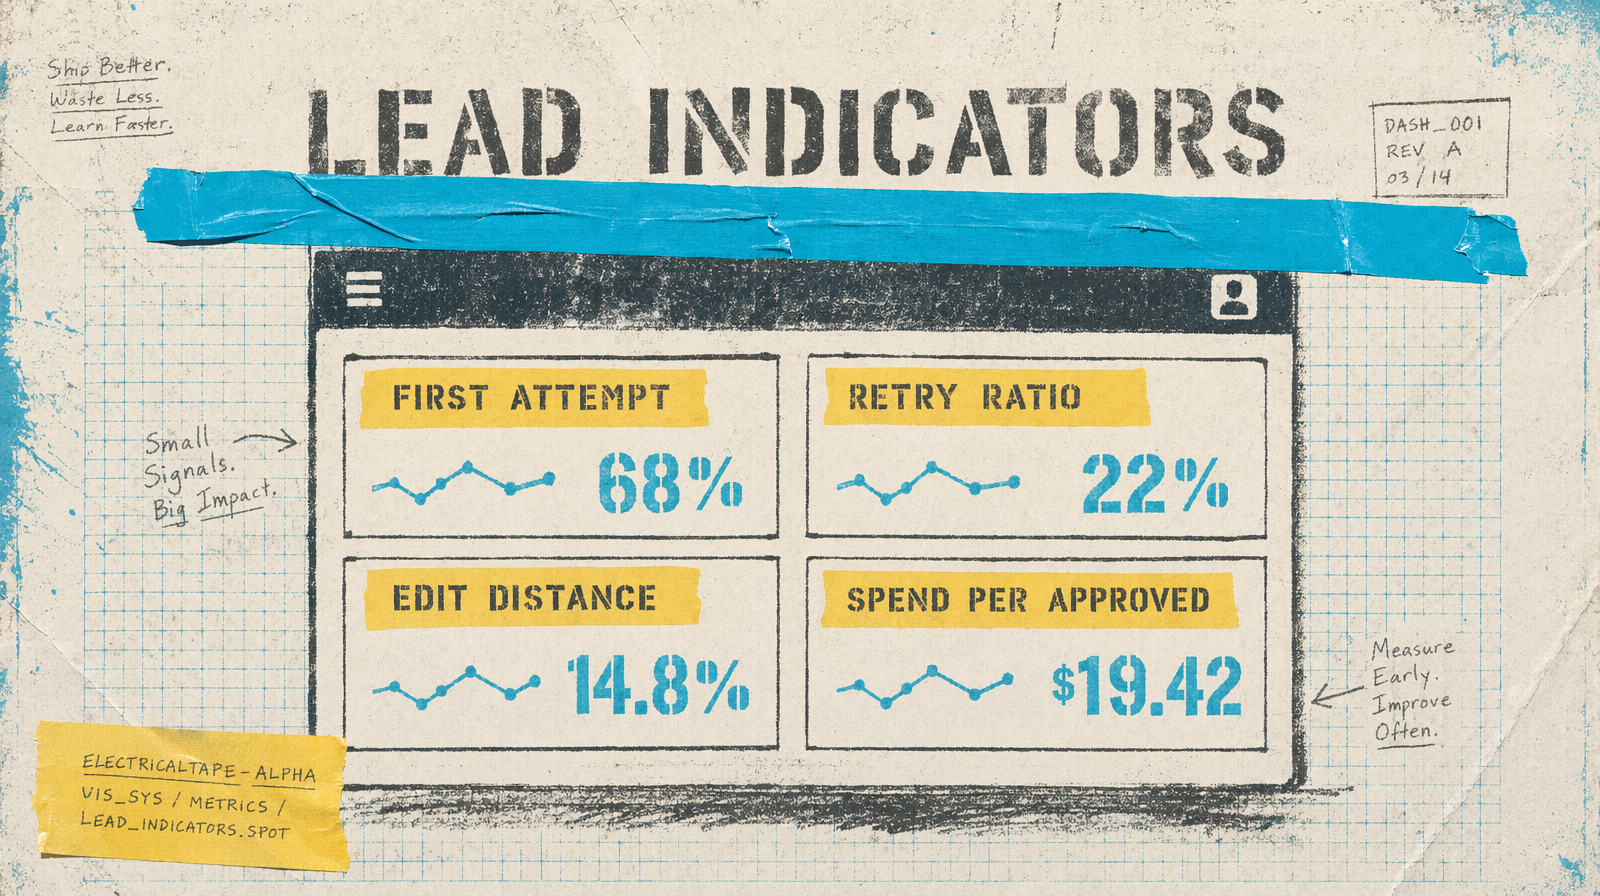
First-attempt success. The percentage of generations that reviewers approve on their first render, no re-prompt. This catches prompt drift before pass-rate does.
Retry ratio. The average number of generations per approved clip. A healthy pipeline runs between 1.1 and 1.3. Above 1.5 and you are running a workshop, not a pipeline.
Edit distance on retries. When a prompt gets re-prompted, how many words changed. Small edits that land are healthy. Large edits that land mean your base prompt is wrong. Large edits that do not land mean the model is the limit.
Spend per approved clip. Total platform cost divided by approved count. Watch the trend, not the absolute number, because models and pricing change.
What to ignore
Total generations per day. Raw count is a vanity metric. A team that generates fewer clips and approves more of them is better than a team generating twice as many with half approved.
Time to first clip. This is useful for onboarding, not for pipeline health. Once the team is comfortable with the tools, it stops moving.
Wall-clock per job. The platform sets this, you do not. Track it only to catch outages.
A small logging schema
1CREATE TABLE generation_log (2 id SERIAL PRIMARY KEY,3 request_id TEXT NOT NULL,4 prompt_id TEXT NOT NULL,5 prompt_version INTEGER NOT NULL,6 model TEXT NOT NULL,7 cost_usd NUMERIC(10, 4),8 approved_on_first_render BOOLEAN,9 final_outcome TEXT CHECK (final_outcome IN ('approved','soft_fail','hard_fail','pending')),10 created_at TIMESTAMPTZ DEFAULT now()11);1213CREATE INDEX ON generation_log (prompt_id, created_at DESC);
Those five writable columns plus timestamps give you every leading indicator you need. Do not add more until you know why.
The weekly view
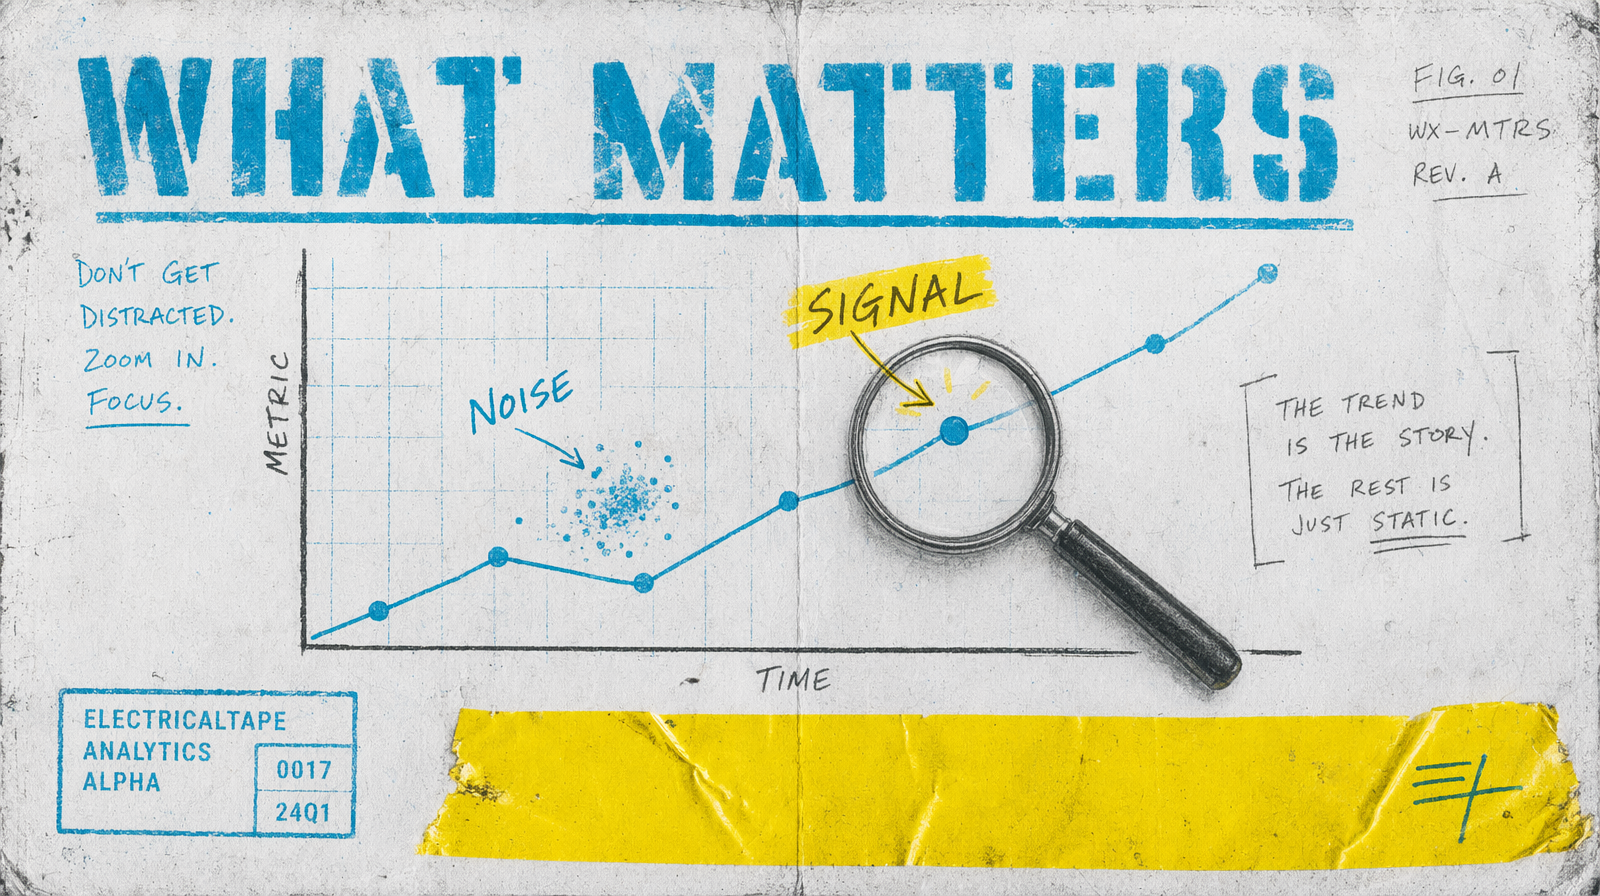
Plot first-attempt success over the last six weeks. A trend down means your prompts are drifting, your reviewers are getting stricter, or your model changed. Any of the three is a conversation, not an alarm.
When a dashboard saves you
You notice retry ratio climbing from 1.2 to 1.5 on a Monday. You pull the last week of logs. Two specific prompts account for most of the retries. You fix those two prompts. Retry ratio drops back to 1.2 by Friday. Pass-rate never moved, because the approvals were still happening, just with more work per clip.
The one number to put on the wall
If you have to pick one, first-attempt success. Every leading indicator feeds it. Every improvement in prompts, models, or review shows up there before it shows up anywhere else.